Contract
Dashboards are a powerful feature used to quickly support decisions related to a specific contract.
The goal is to give the user the ability to control processes in a very friendly and comprehensive way.
As a project manager, it is very useful to understand the status of a specific client and control the profitability of each project and contract. This way the PM will have the necessary tools to negotiate with their clients.
There are several dashboards at the Contract-level available in the system that will display different information.
Burn Dashboard
- Select the contract you want to analyze.
- Click on the "Burn Dashboard" tab.
- Select the project you want to check.
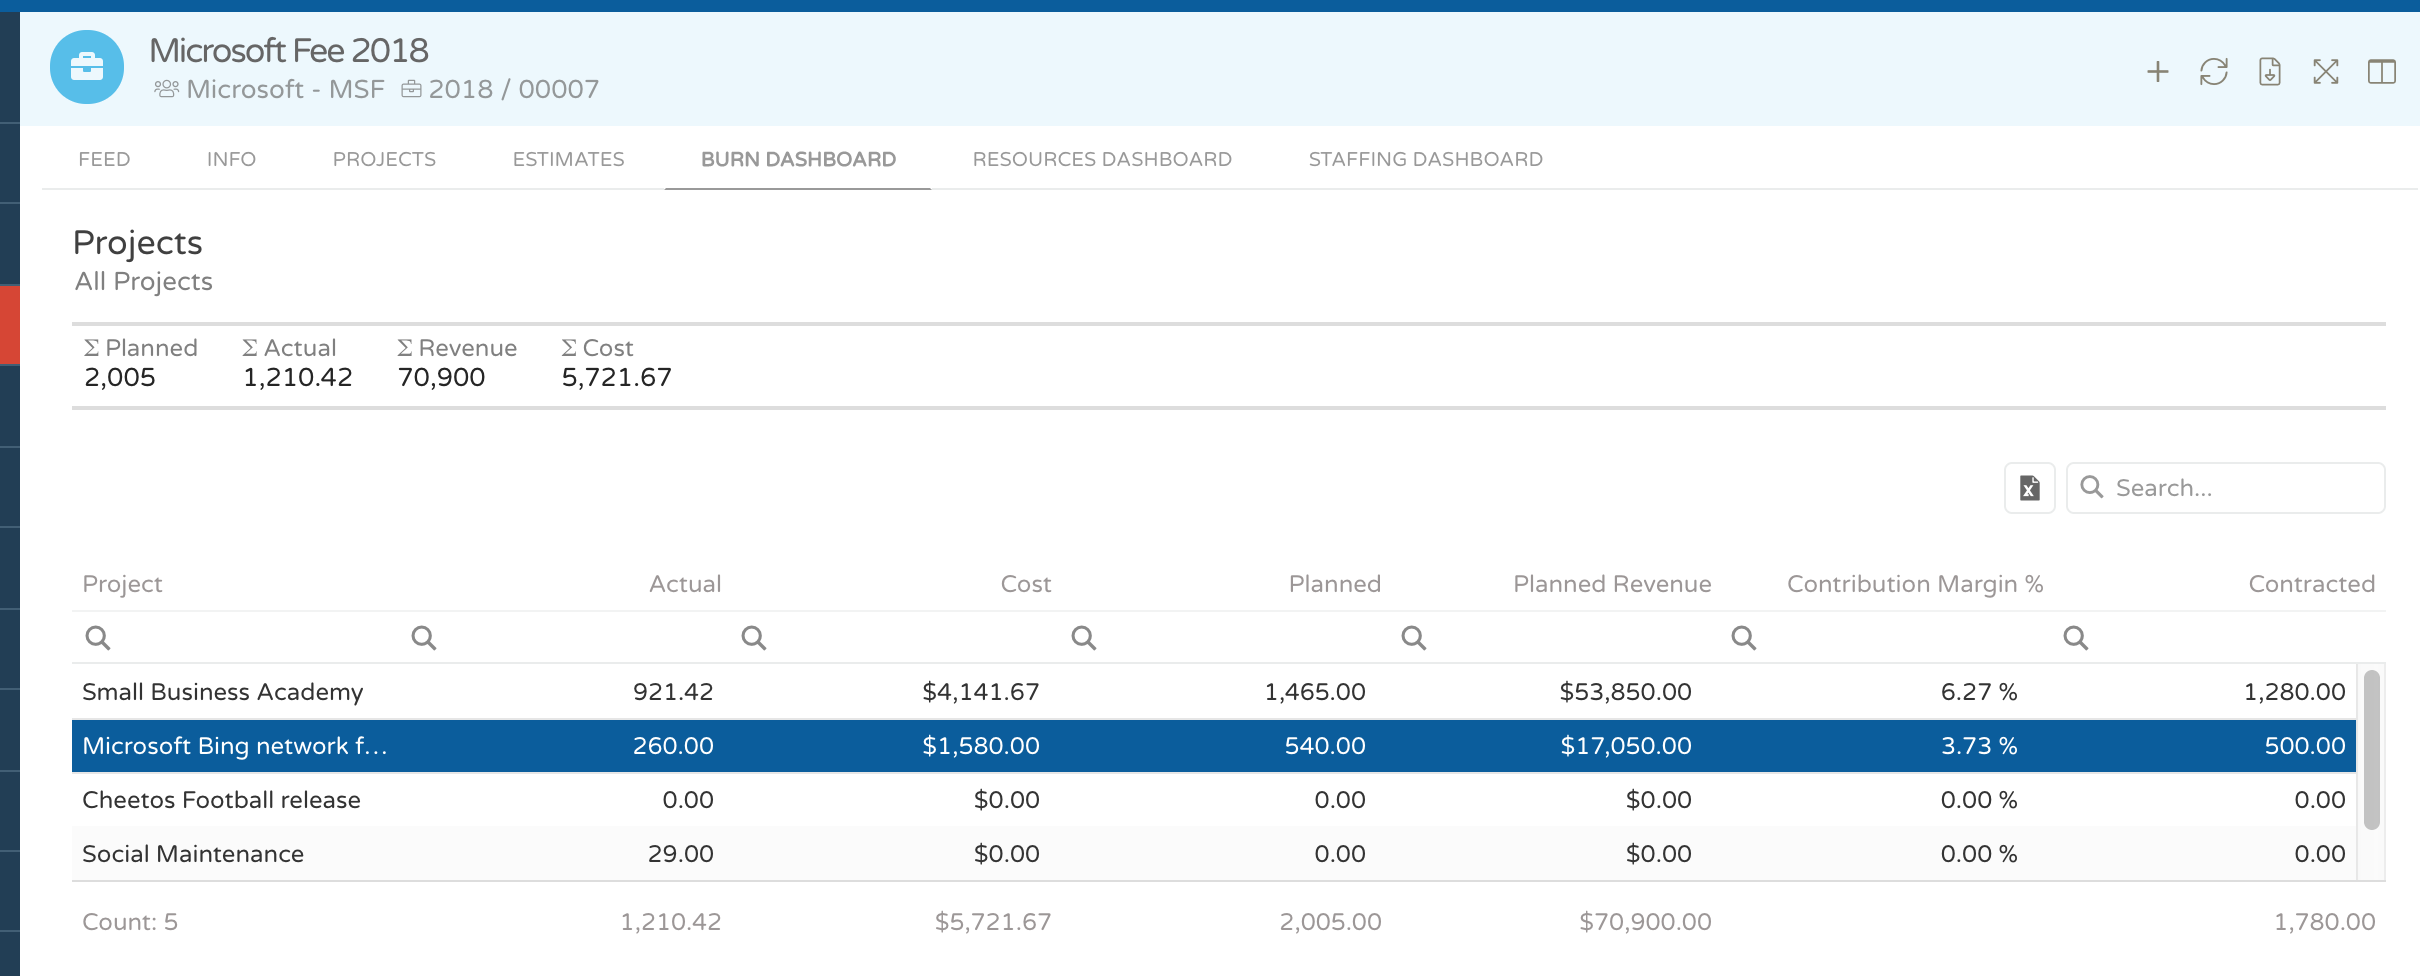
You will find several representations that will show you in a glimpse whether your Contract is already burned.
Also, there's a summary representation that will show you the total planned, contracted, cost and income.
After selecting the project inside the contract you wish to analyze in detail, the system will give you the information of actual hours, actual cost, planned hours, planned income, contribution margin and contracted hours applied under that specific project.
- Below you will find several pie representations related to the project you have selected.
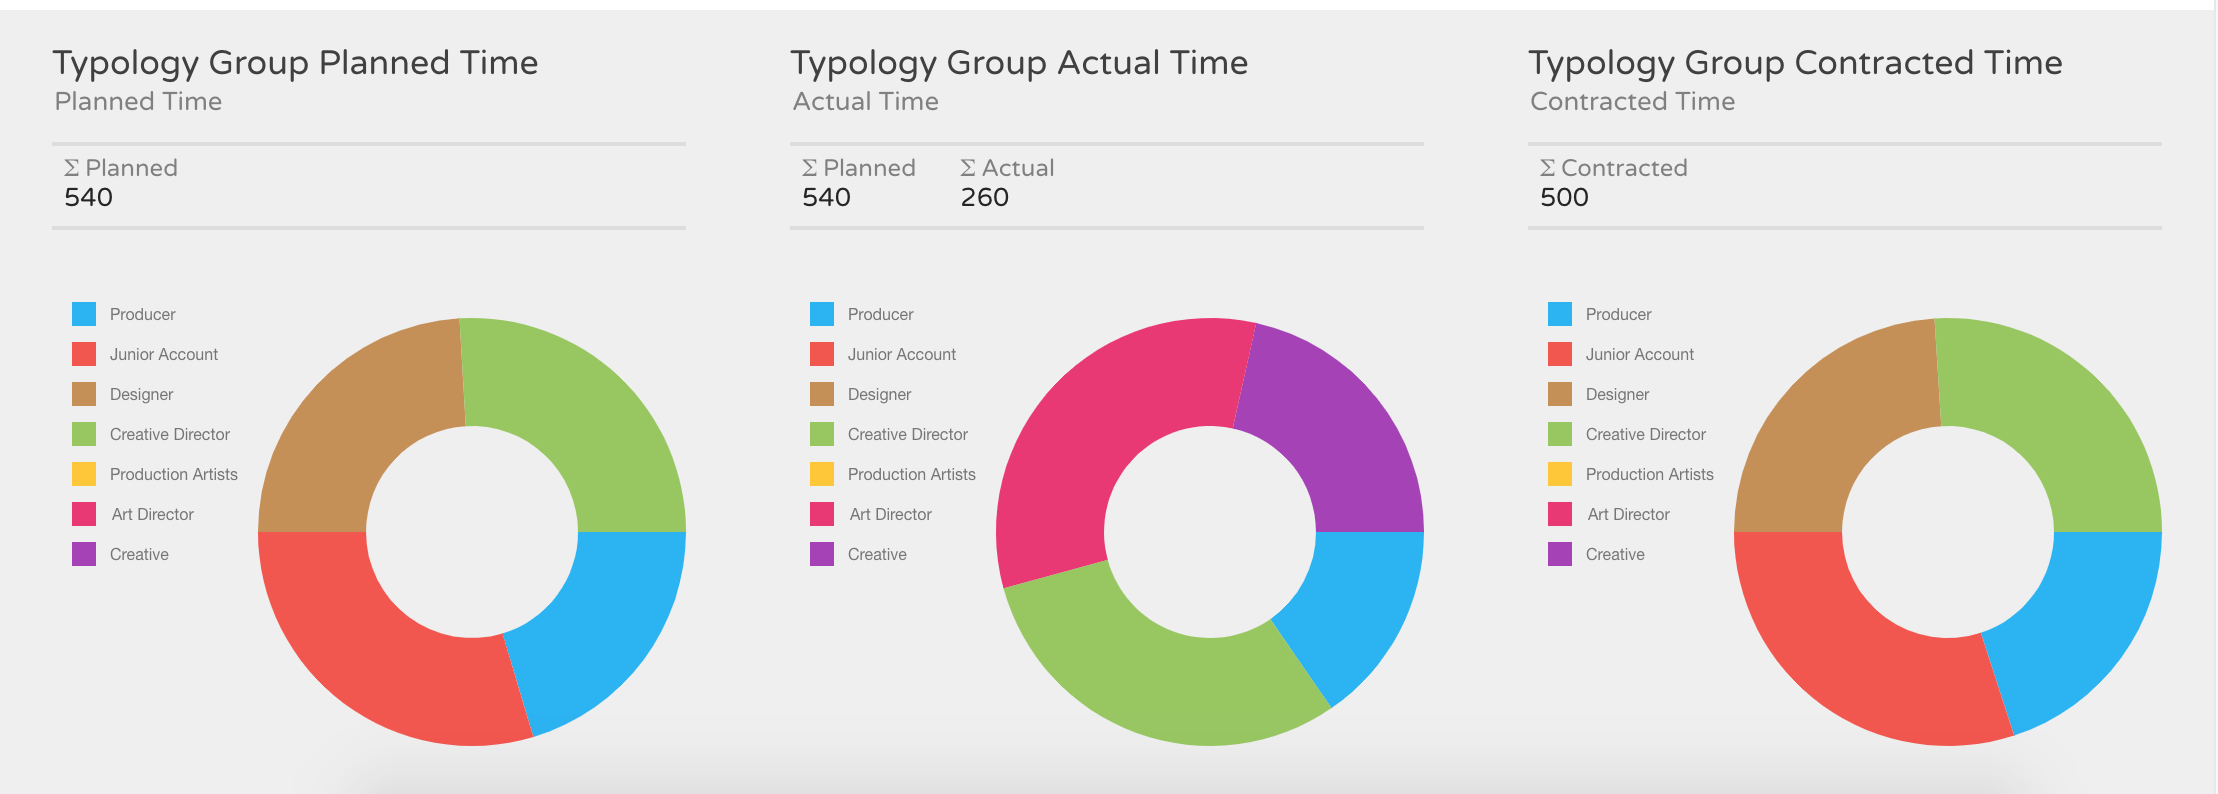
Typology group planned time
This representation shows the number of planned hours per typology group.
Typology group actual time
This representation shows the number of actual hours per typology group.
Typology group contracted time
This representation shows the number of contracted hours per typology group, applied to the project previously selected.
Resources Dashboard
- Inside the previously selected contract
- Click on the "Resources Dashboard" tab
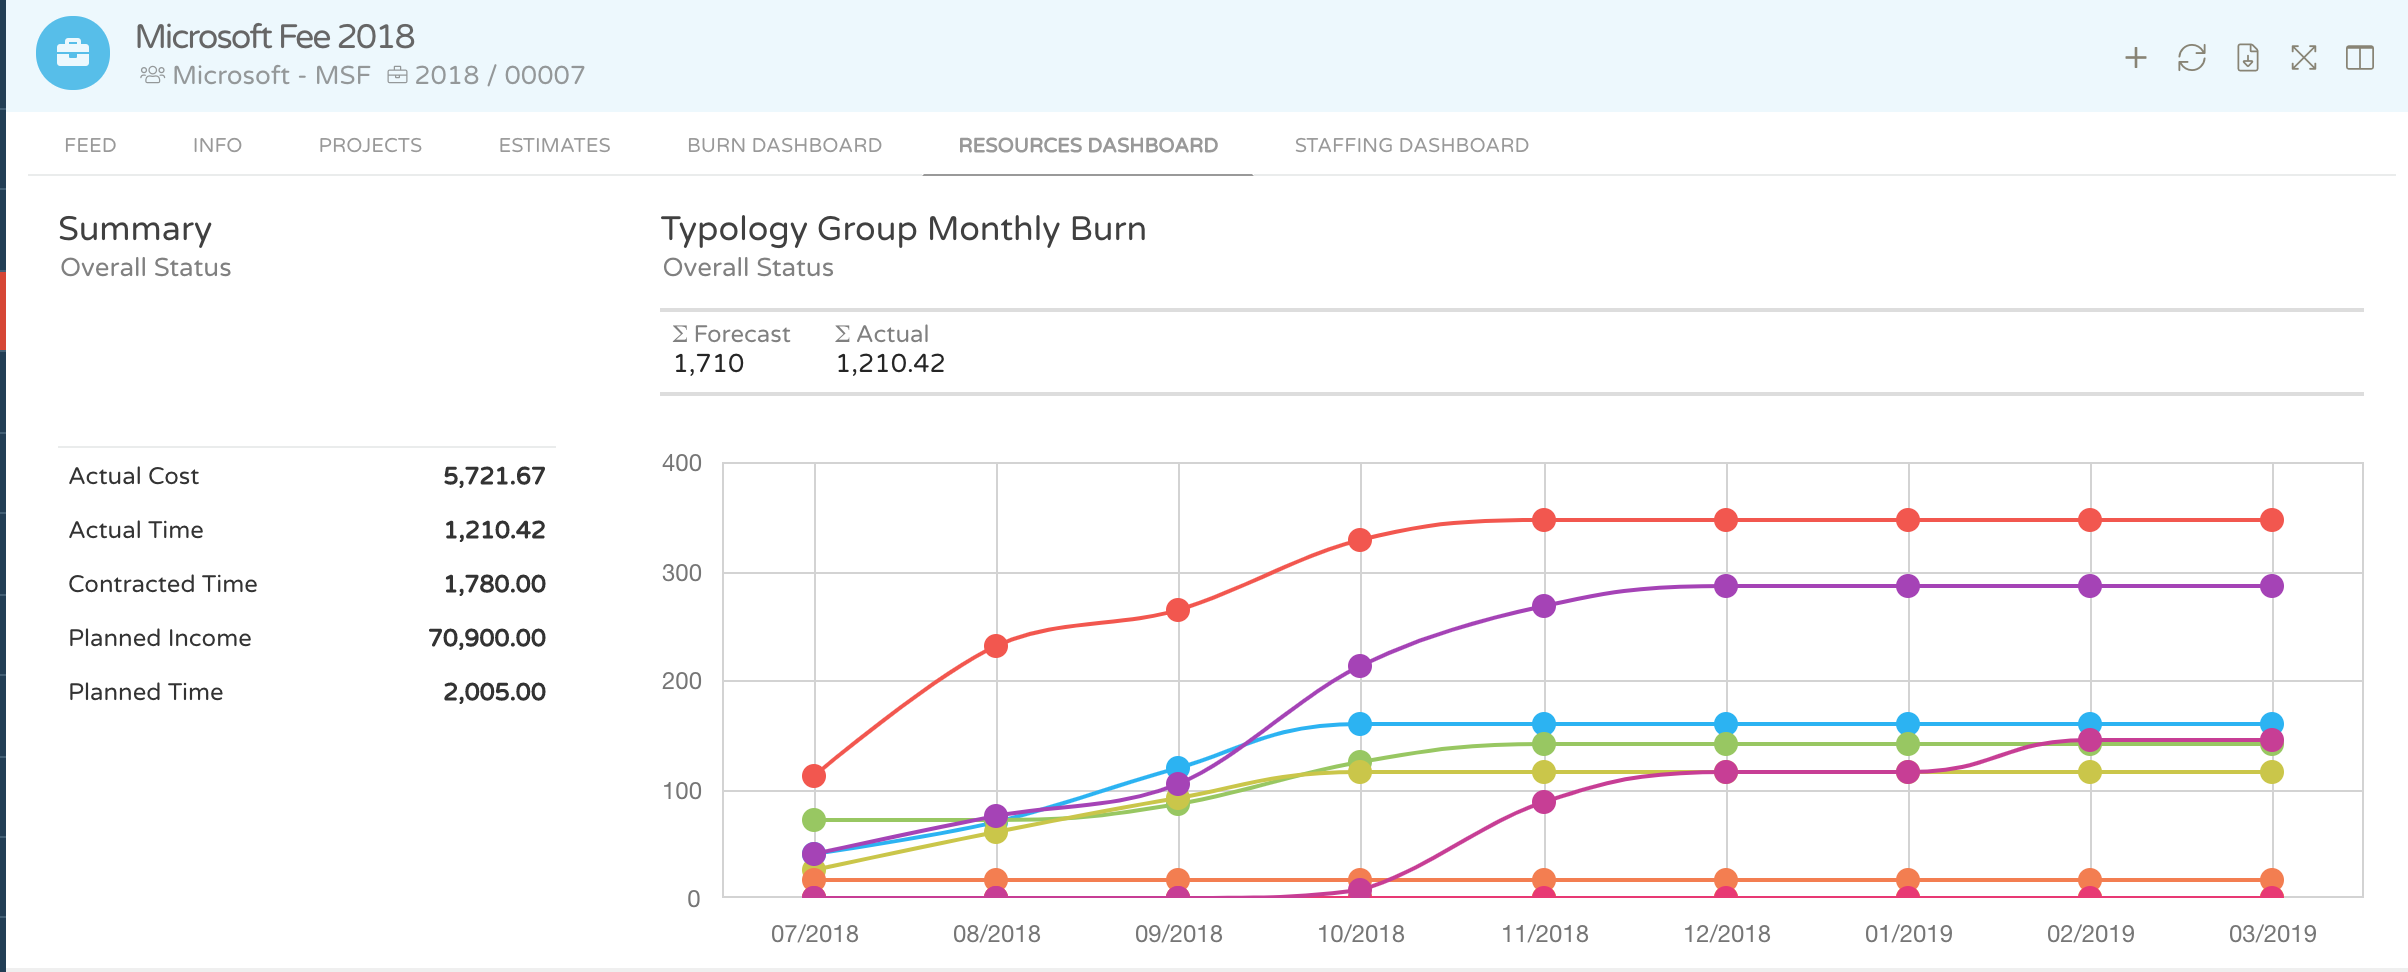
You will find out a summary with the overall status of your contract, in this example, we can observe that the actual time is almost burning out the contracted hours
Additionally, you will be able to control which typology is filling in more actual hours.
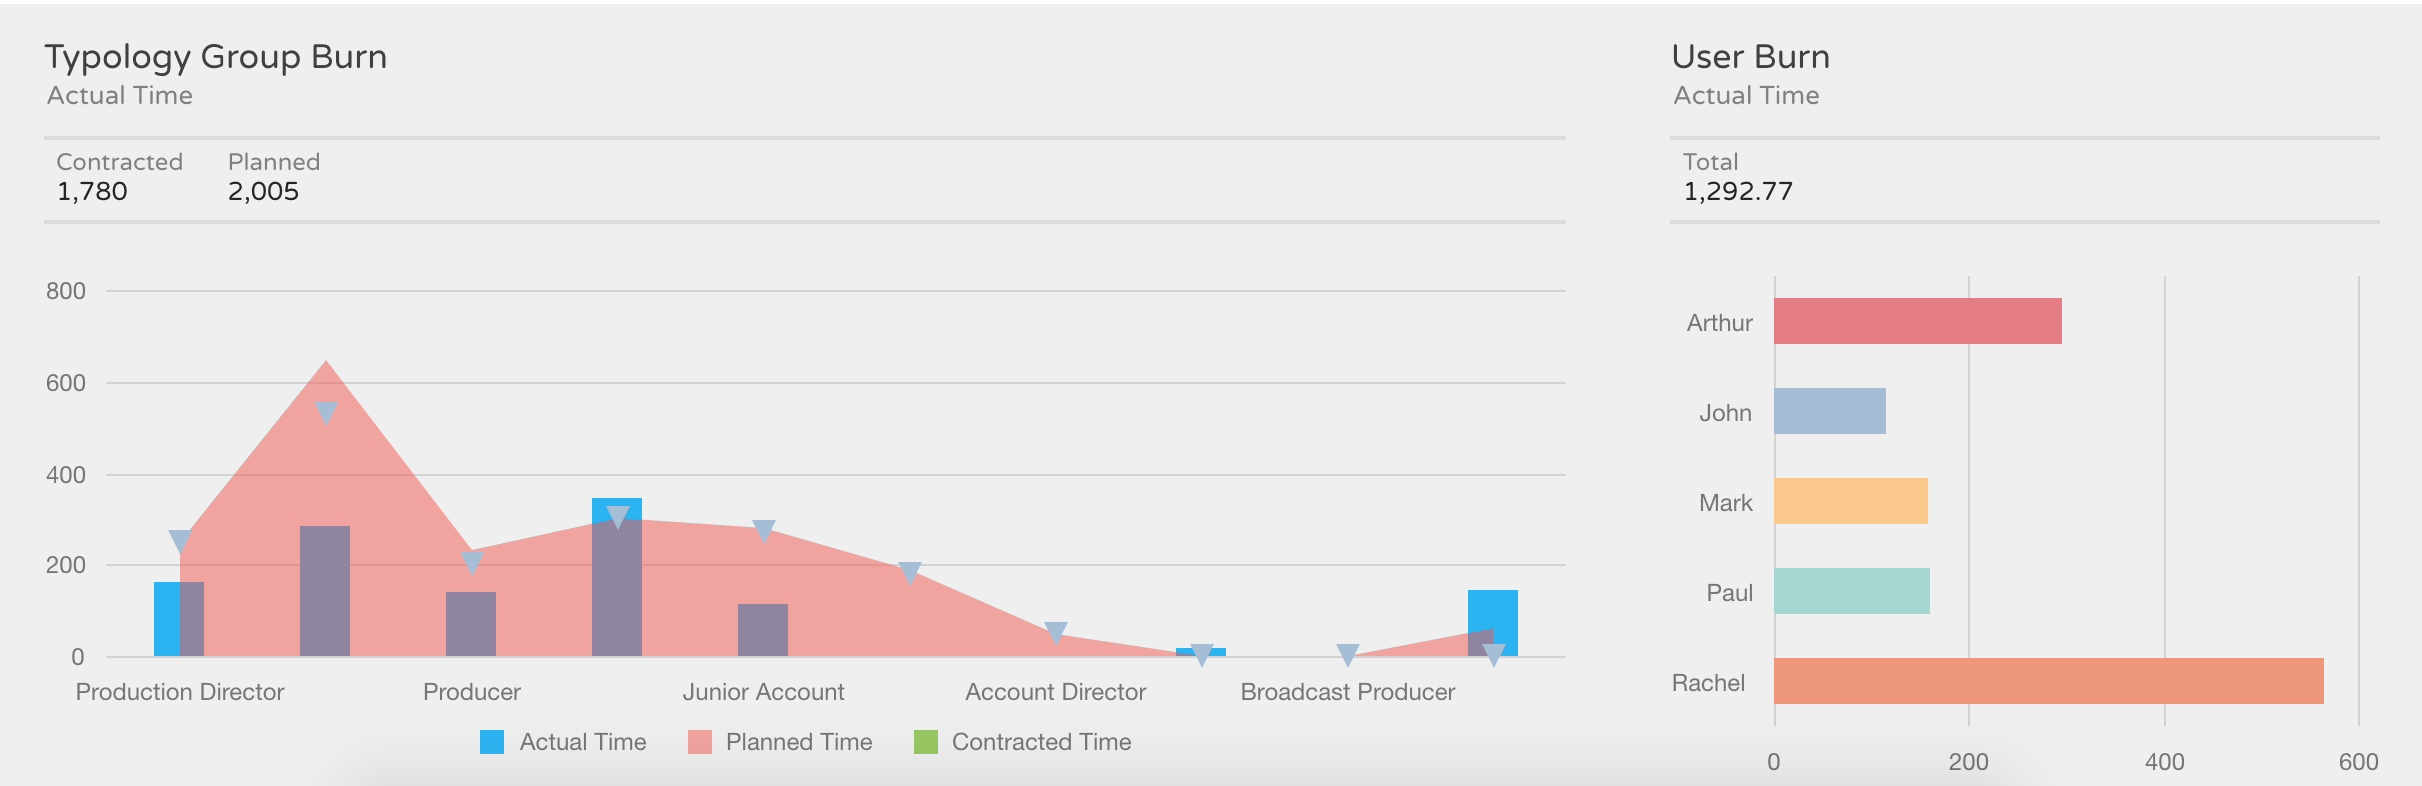
Typology group burn
This representation will allow you to check if the planned hours or actual hours are burning the contracted hours you have previously sold to your client.
User burn
Also, you will be able to check which user is filling in more hours under your project/contract
Staffing Dashboard
- Inside the previously selected contract
- Click on the "Staffing Dashboard" tab
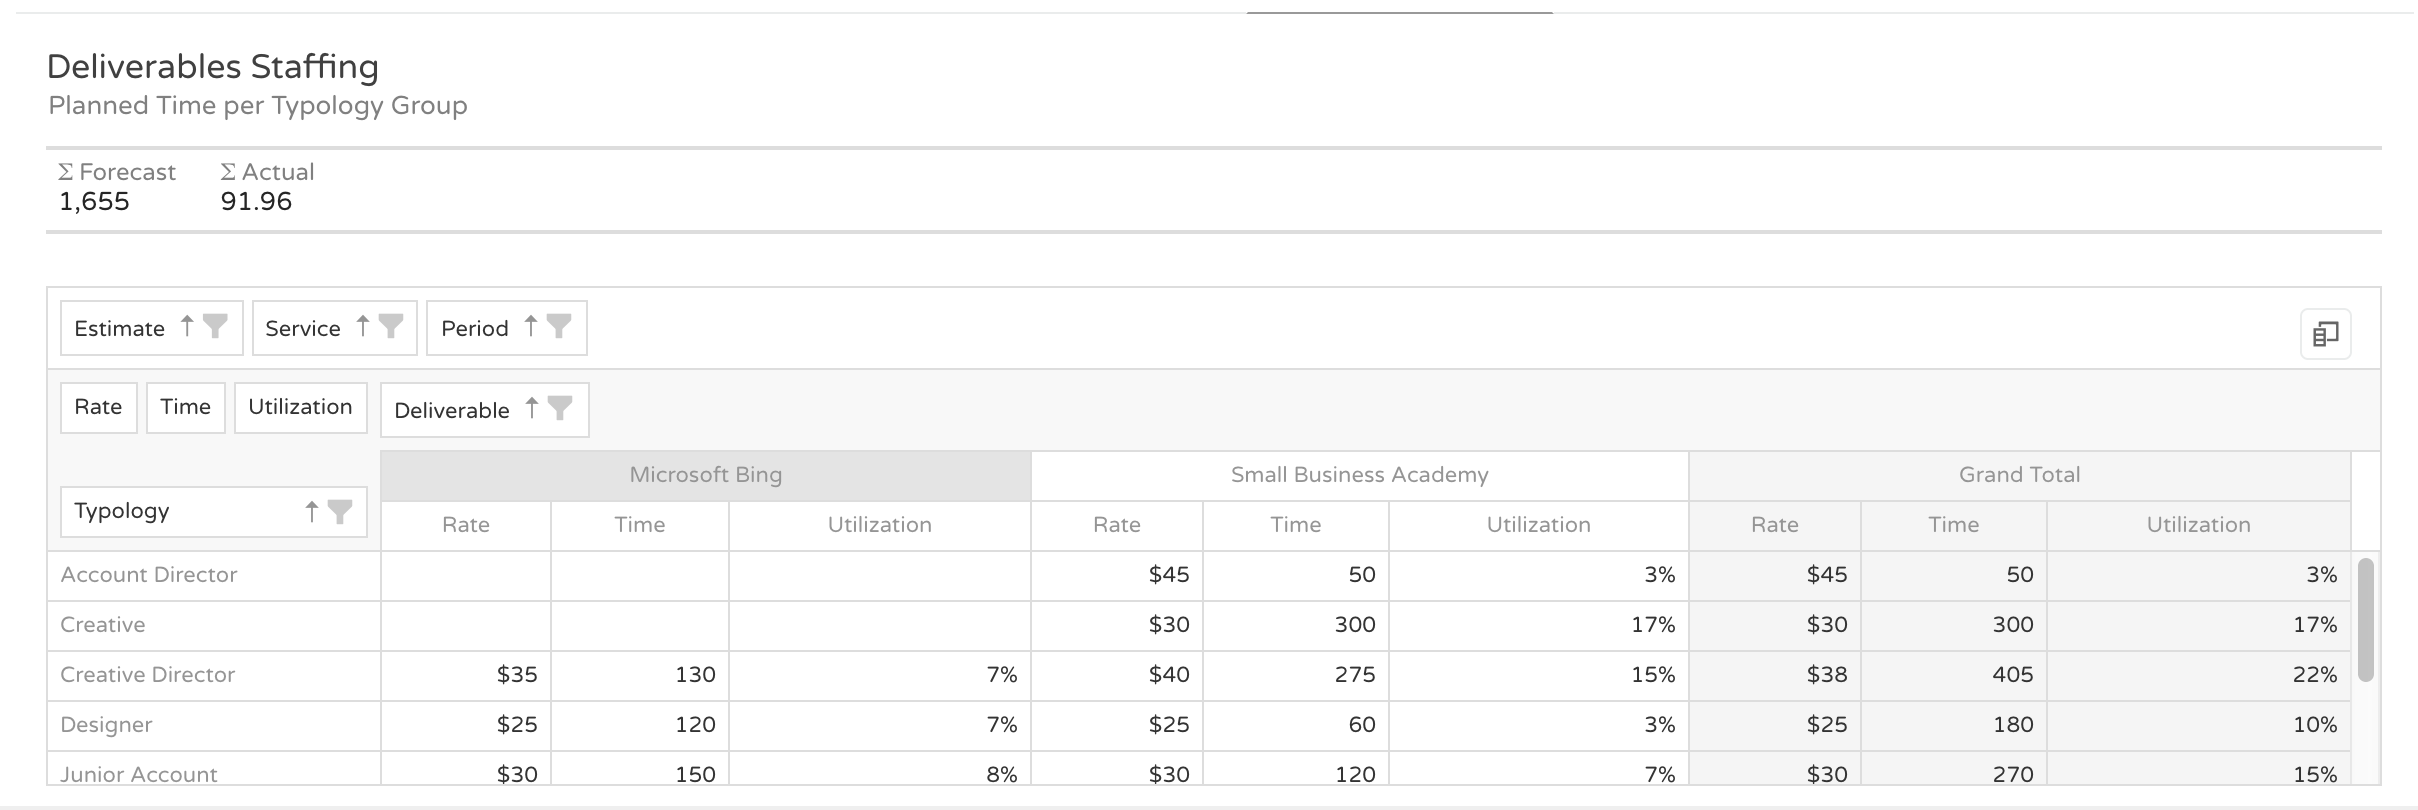
The first representation works as a pivot table and shows you the planned time per typology group per deliverable (meaning the services you have previously sold/quote to your client)
It works as an Excel pivot table which allows you to re-organize your view if needed, adding information from the column chooser.
By default, you will be able to check per deliverable the number of planned hours, the related rate and the utilization percentage of a specific typology group.
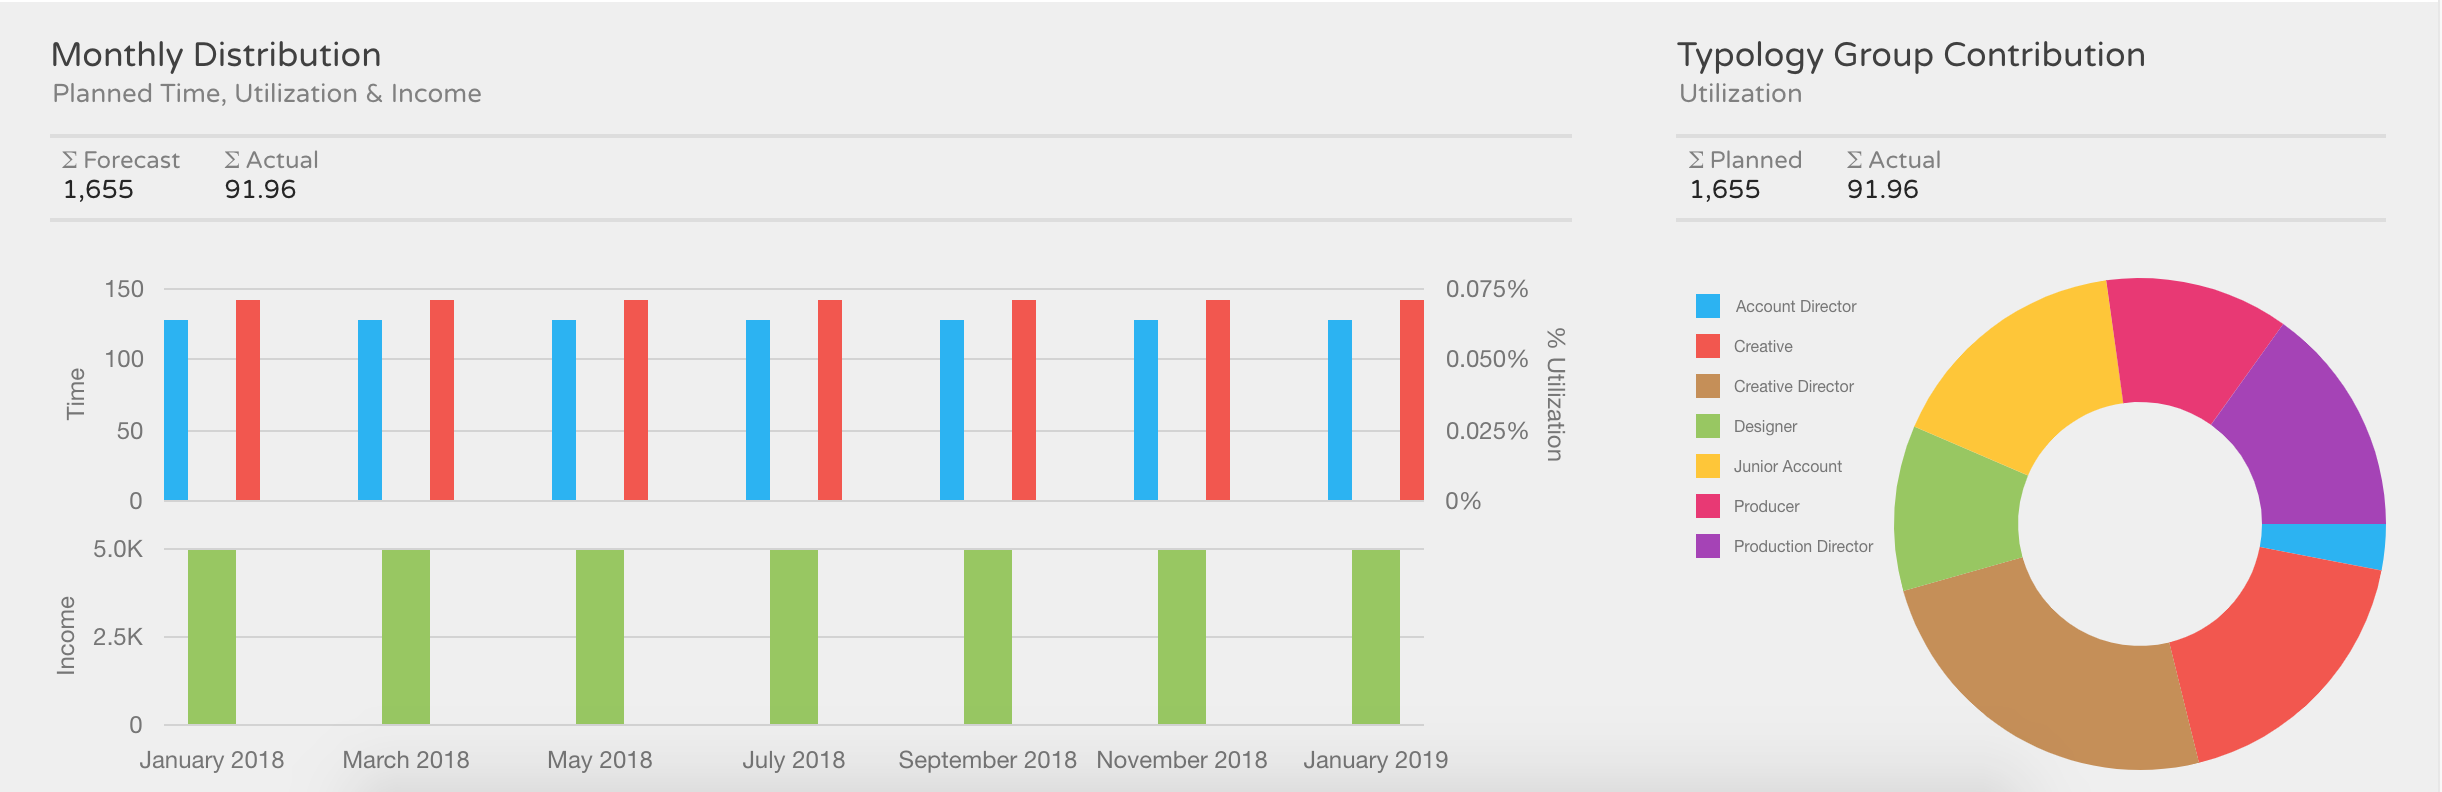
Monthly distribution
This representation allows you to control on a monthly basis the planned time VS the user's utilization and income.
Typology Contribution
Based on planned VS actual time this representation shows the contribution of each typology group for your contract
Please note that you can print out or export any of the described dashboards