Burn and Utilization
Dashboards are a powerful feature used to quickly support decisions related to a specific contract.
The goal is to give the user the ability to control processes in a very friendly and comprehensive way.
As a project manager, it is very useful to understand the status of a specific client and control the profitability of each project and contract. This way the PM will have the necessary tools to negotiate with their clients.
There are several dashboards at the Contract-level available in the system that will display different information.
Burn and Utilization - Fee
- Select the contract you want to analyze.
- Click on the "Burn and Utilization - Fee" tab.

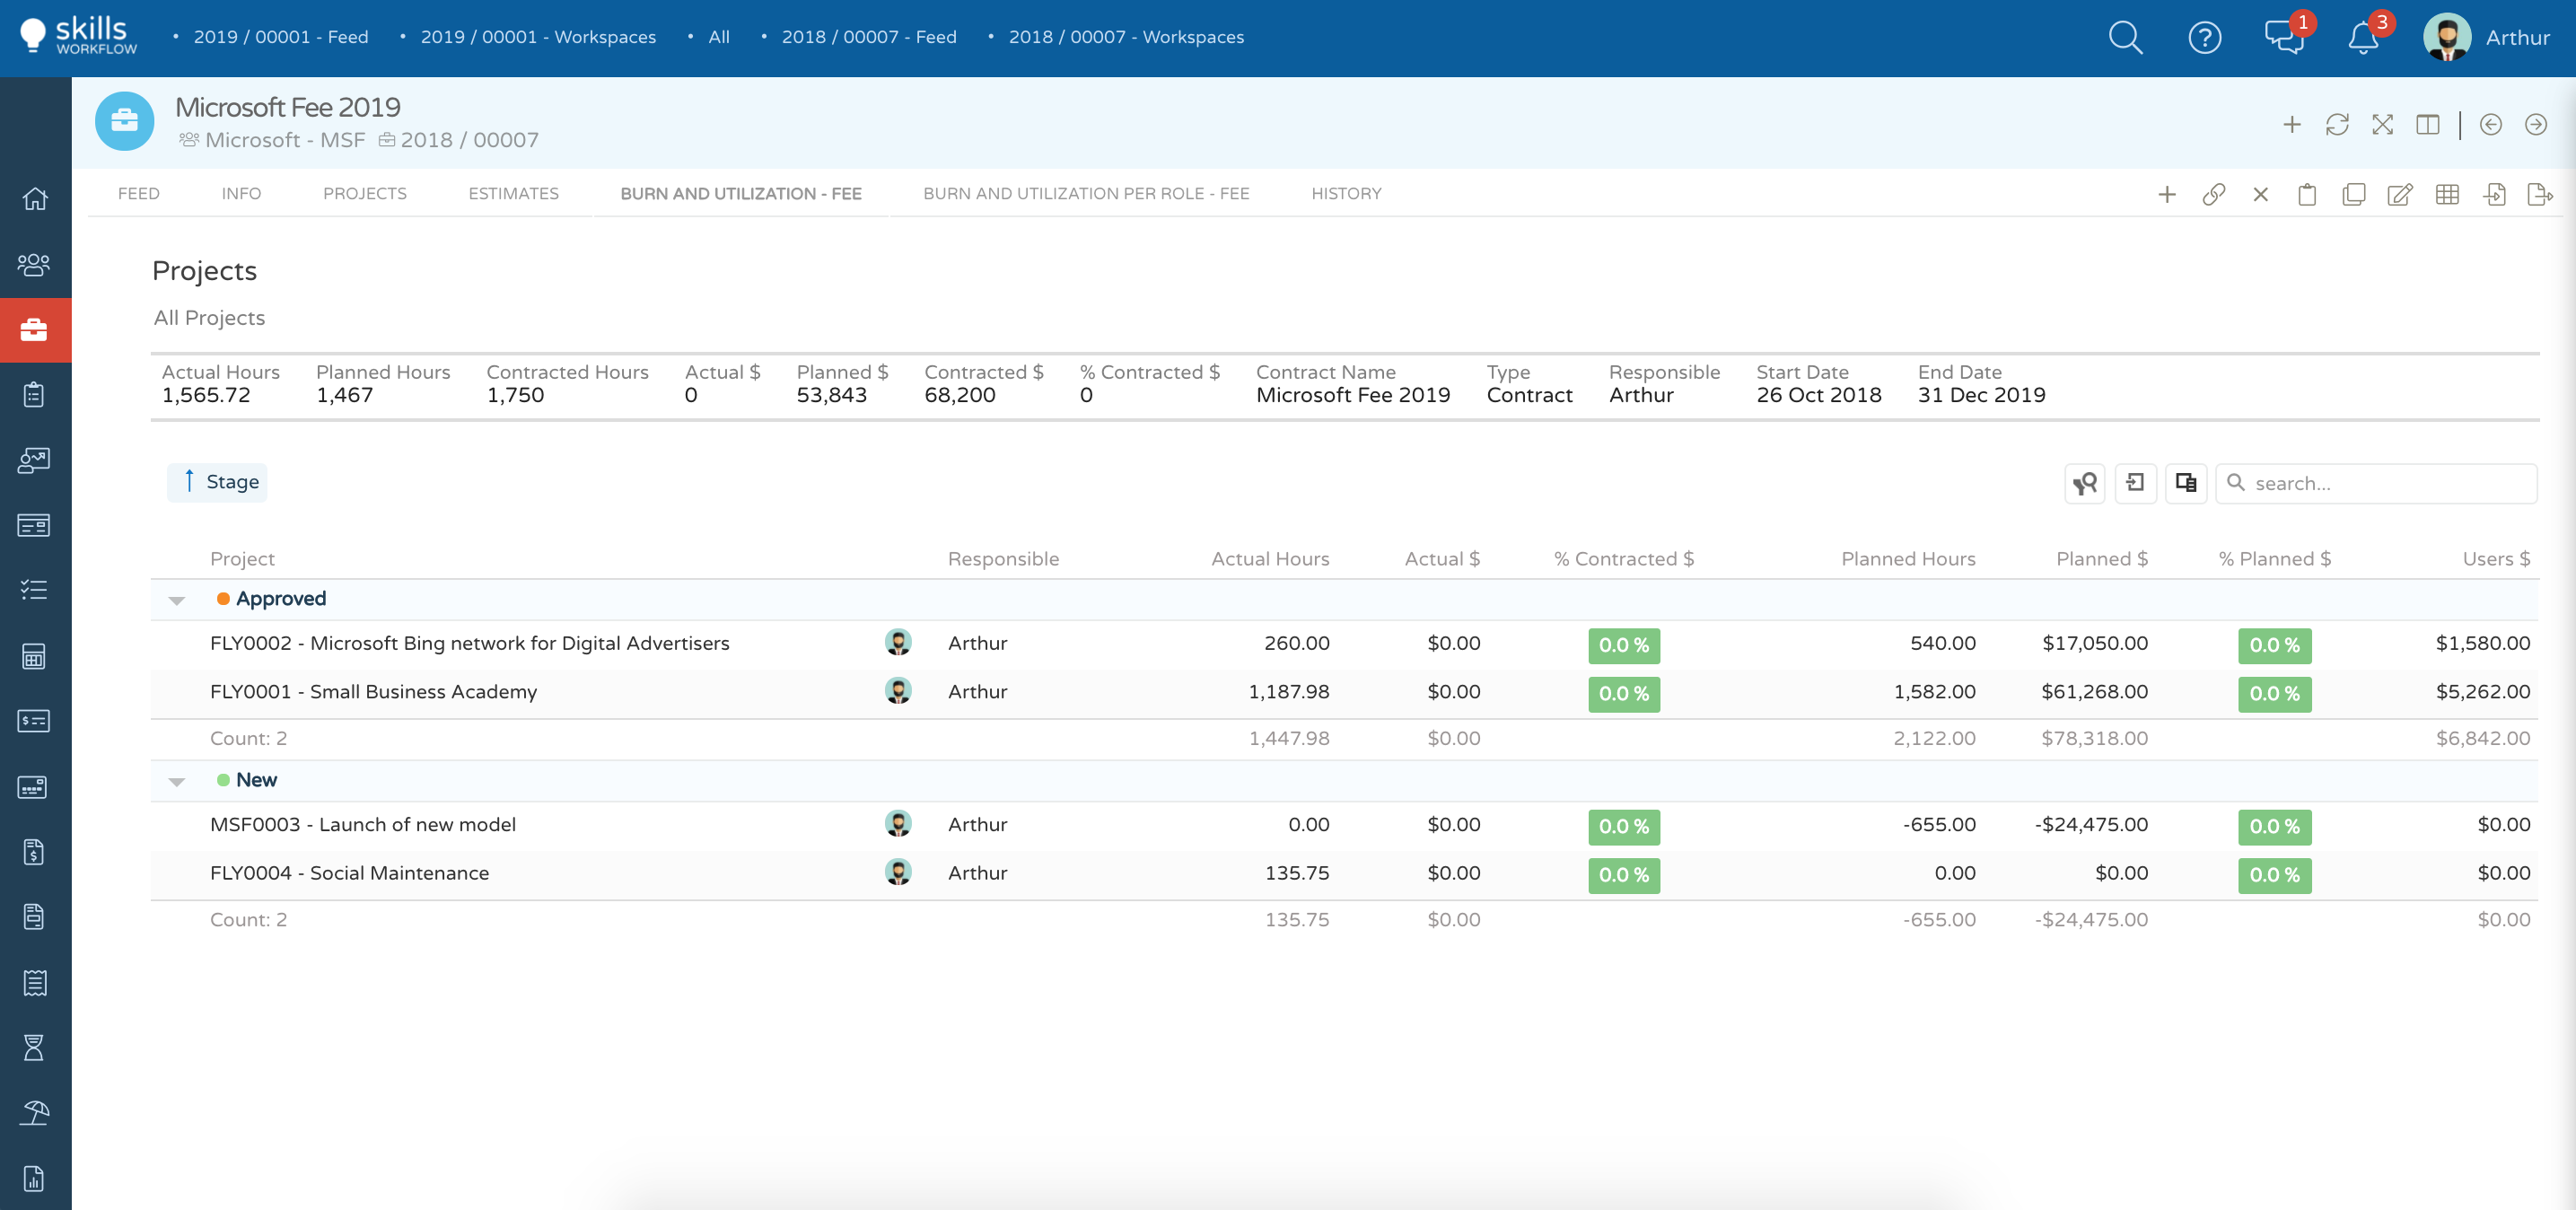
The first part provides a summary total for all projects mapped to the fee of the following:
- Actual Hours – actual timesheet hours logged to each project to date
- Planned Hours – planned hours for each project
- Contracted Hours – contracted/sold hours per fee proposal
- Actual $ - actual hours valued using Rate Card assigned to the Fee Proposal
- Planned $ - planned hours valued using Rate Card assigned to the Fee Proposal
- Contracted $ - contracted/sold hours valued using Rate Card assigned to the Fee Proposal
- % Contracted $ - (Actual $ / Contracted $) x 100
The second part shows the breakdown listing per Project classified and grouped according to Project Stage. Header Filter, Export and Column Chooser features are available for this list.
Burn and Utilization Per Role - Fee Click on the "Burn and Utilization Per Role - Fee" tab;

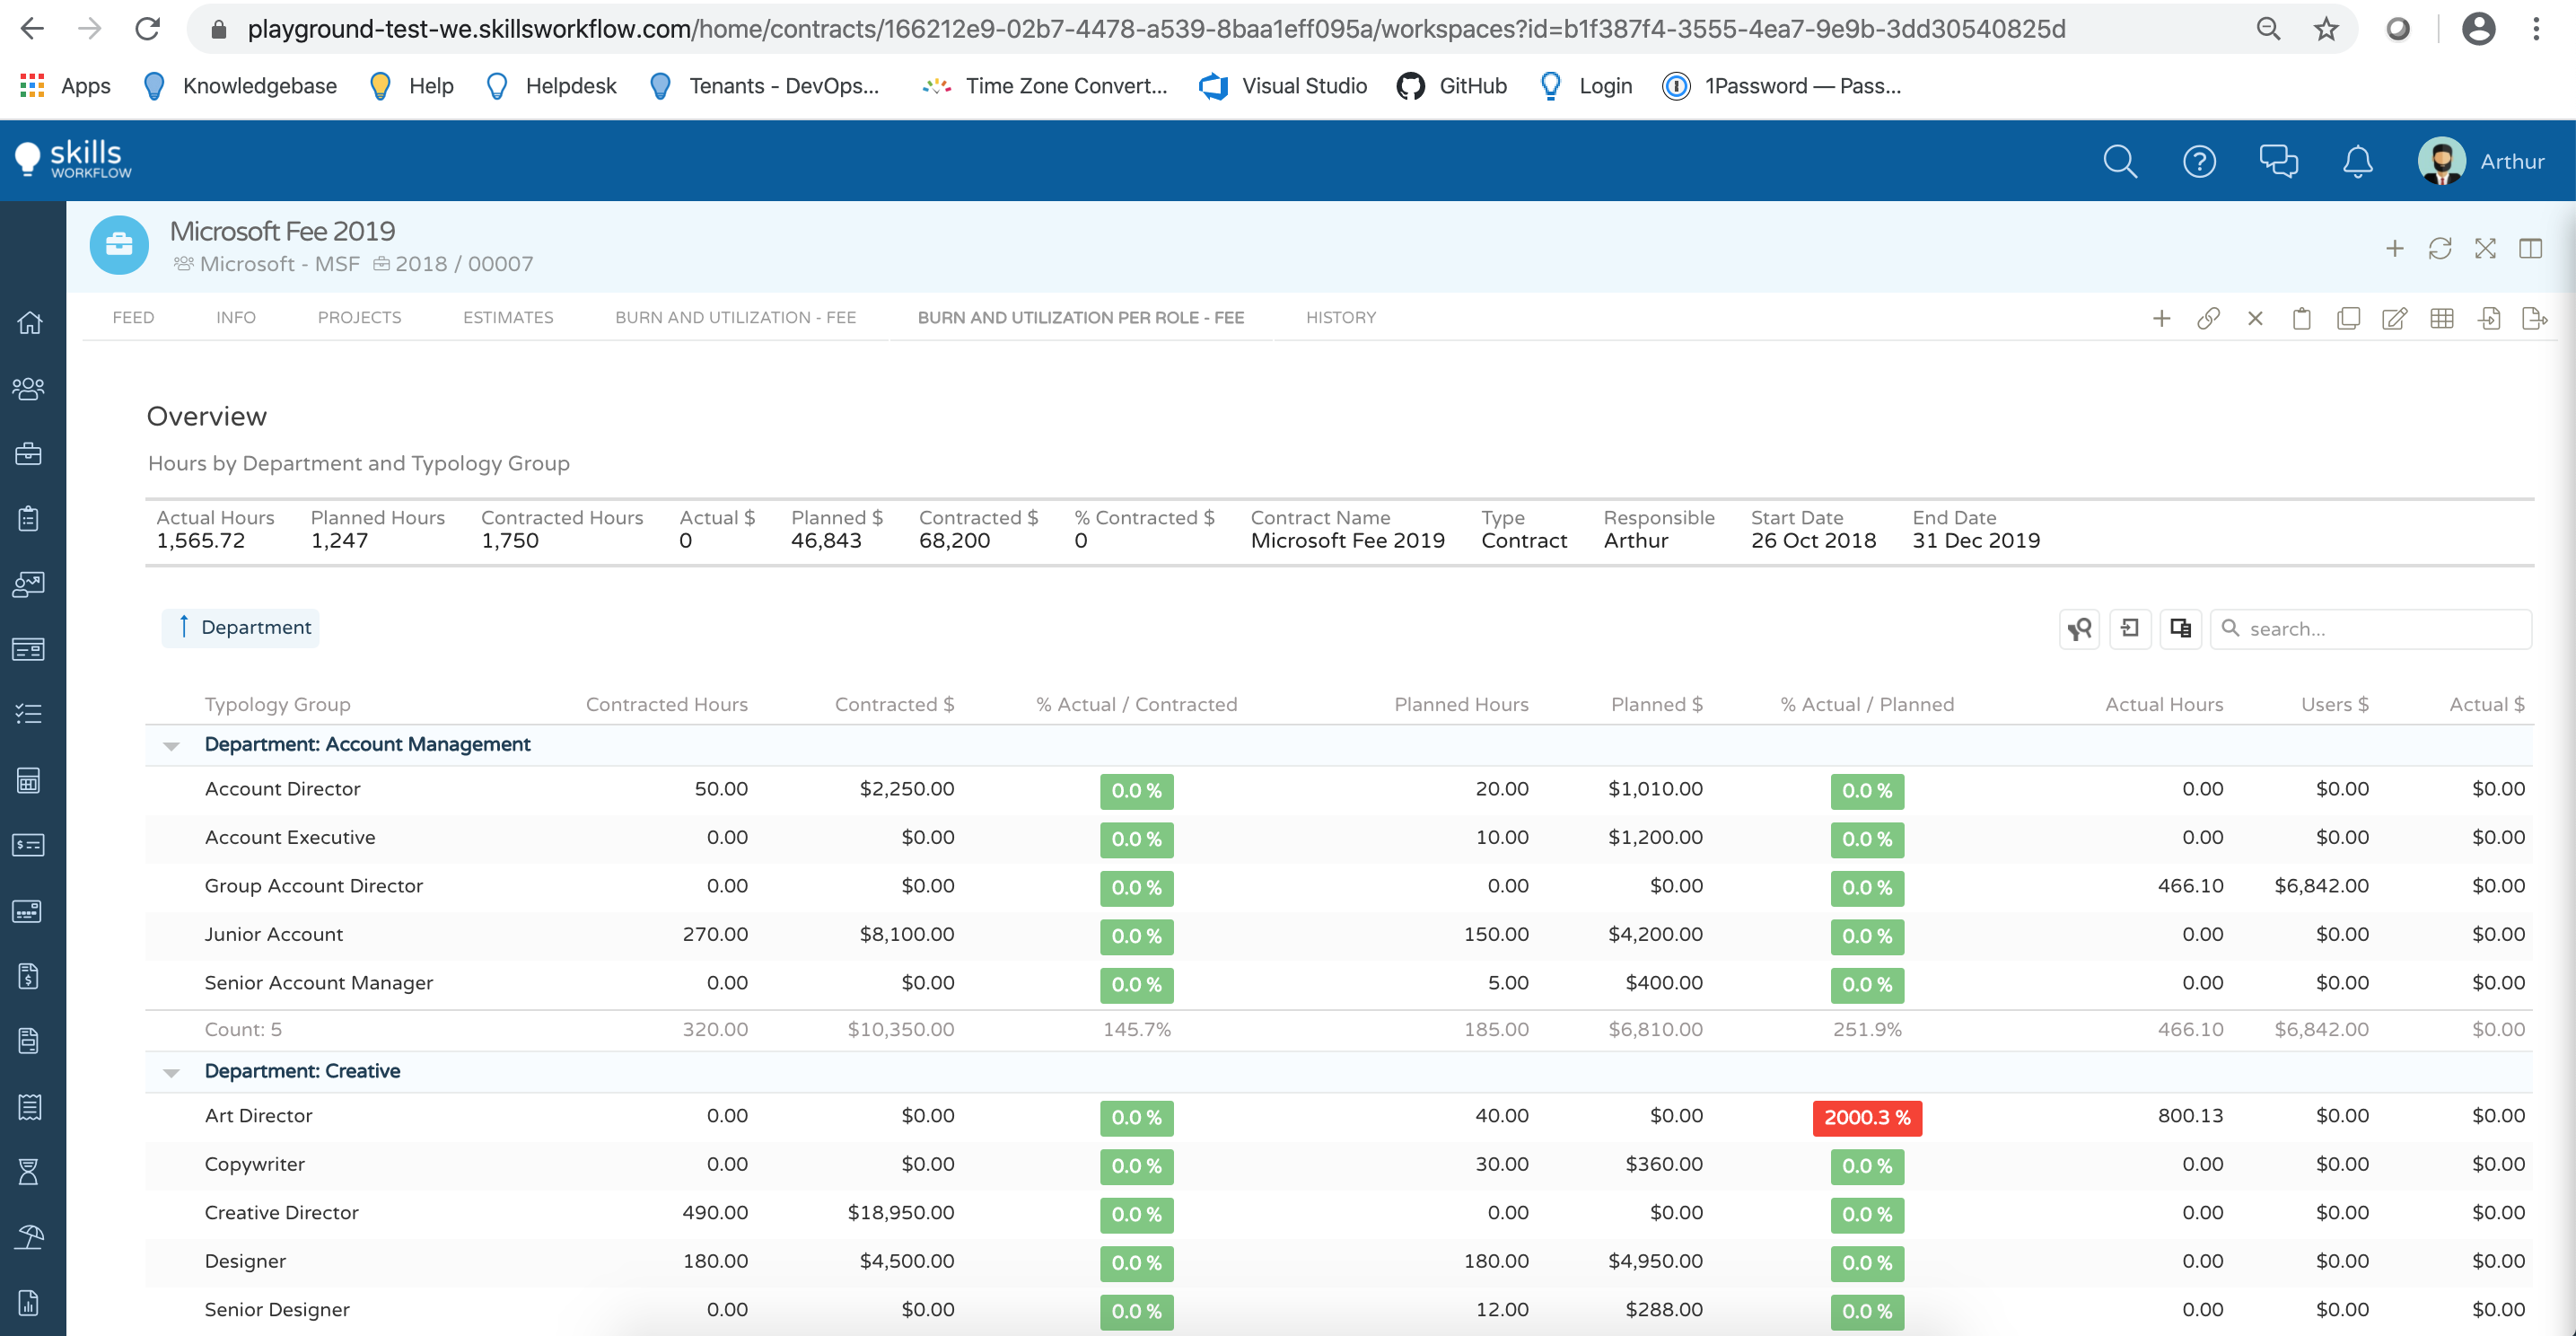
The first part provides a summary total for all typology groups quoted in the fee and/or logged actual hours to the projects mapped to the fee of the following:
- Actual Hours – actual timesheet hours logged to each project to date
- Planned Hours – planned hours for each project
- Contracted Hours – contracted hours of the fee proposal
- Actual $ - actual hours valued using actual rates per user
- Planned $ - planned hours valued using Rate Card assigned to the Fee Proposal
- Contracted $ - contracted hours valued using Rate Card assigned to the Fee Proposal
- % Contracted $ - (Actual $ / Contracted $) x 100
The second part shows the breakdown listing per Typology Group per Department. Header Filter, Export and Column Chooser features are available for this list.

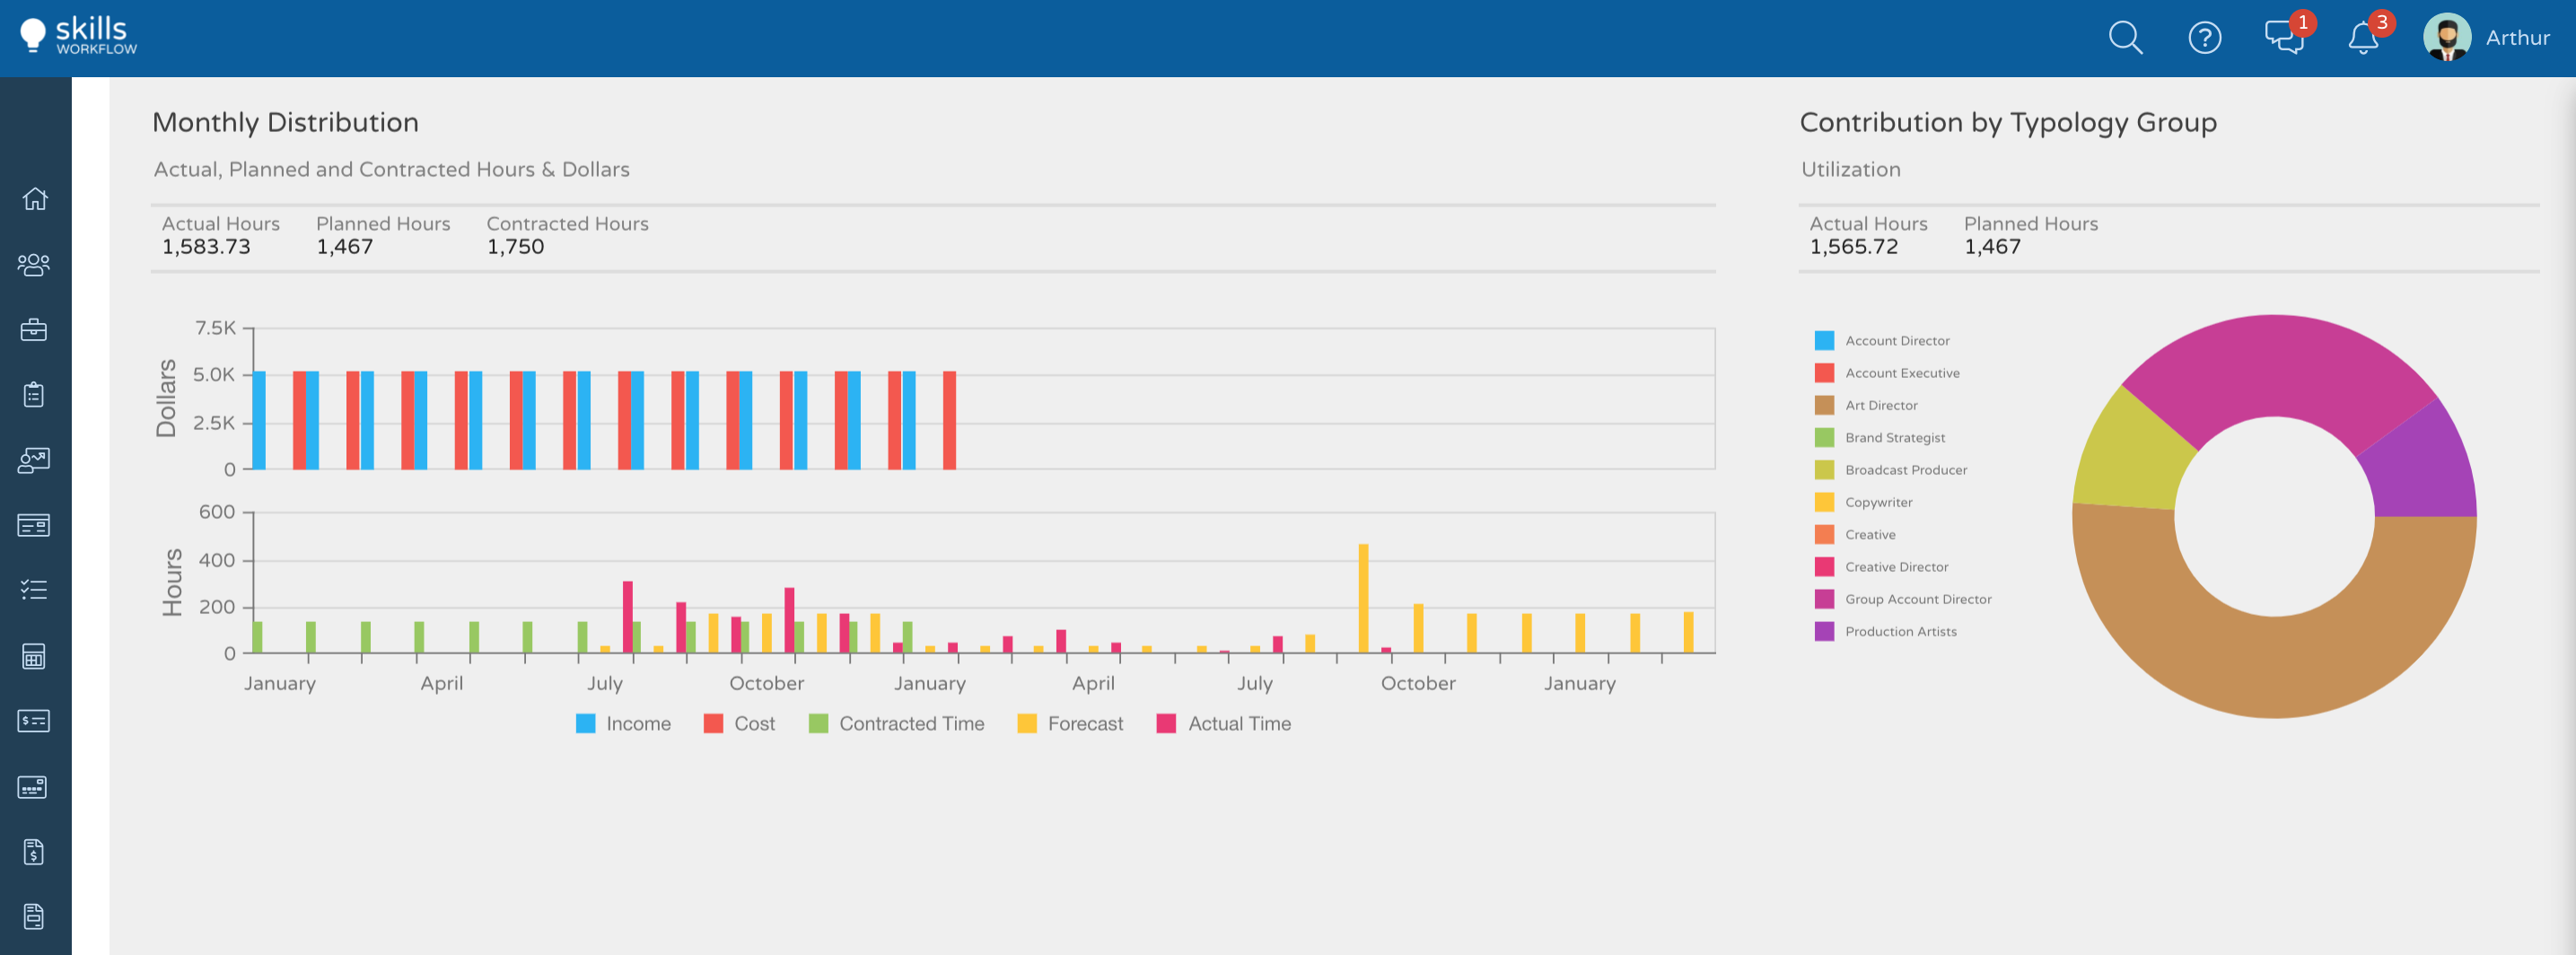
Monthly Distribution
Dollars – A time graph showing Revenue and Cost per Month
Hours – A time graph showing Contracted, Forecast and Actual Hours per Month
Contribution by Typology Group
A pie chart showing the breakdown of actual hours by Typology Group

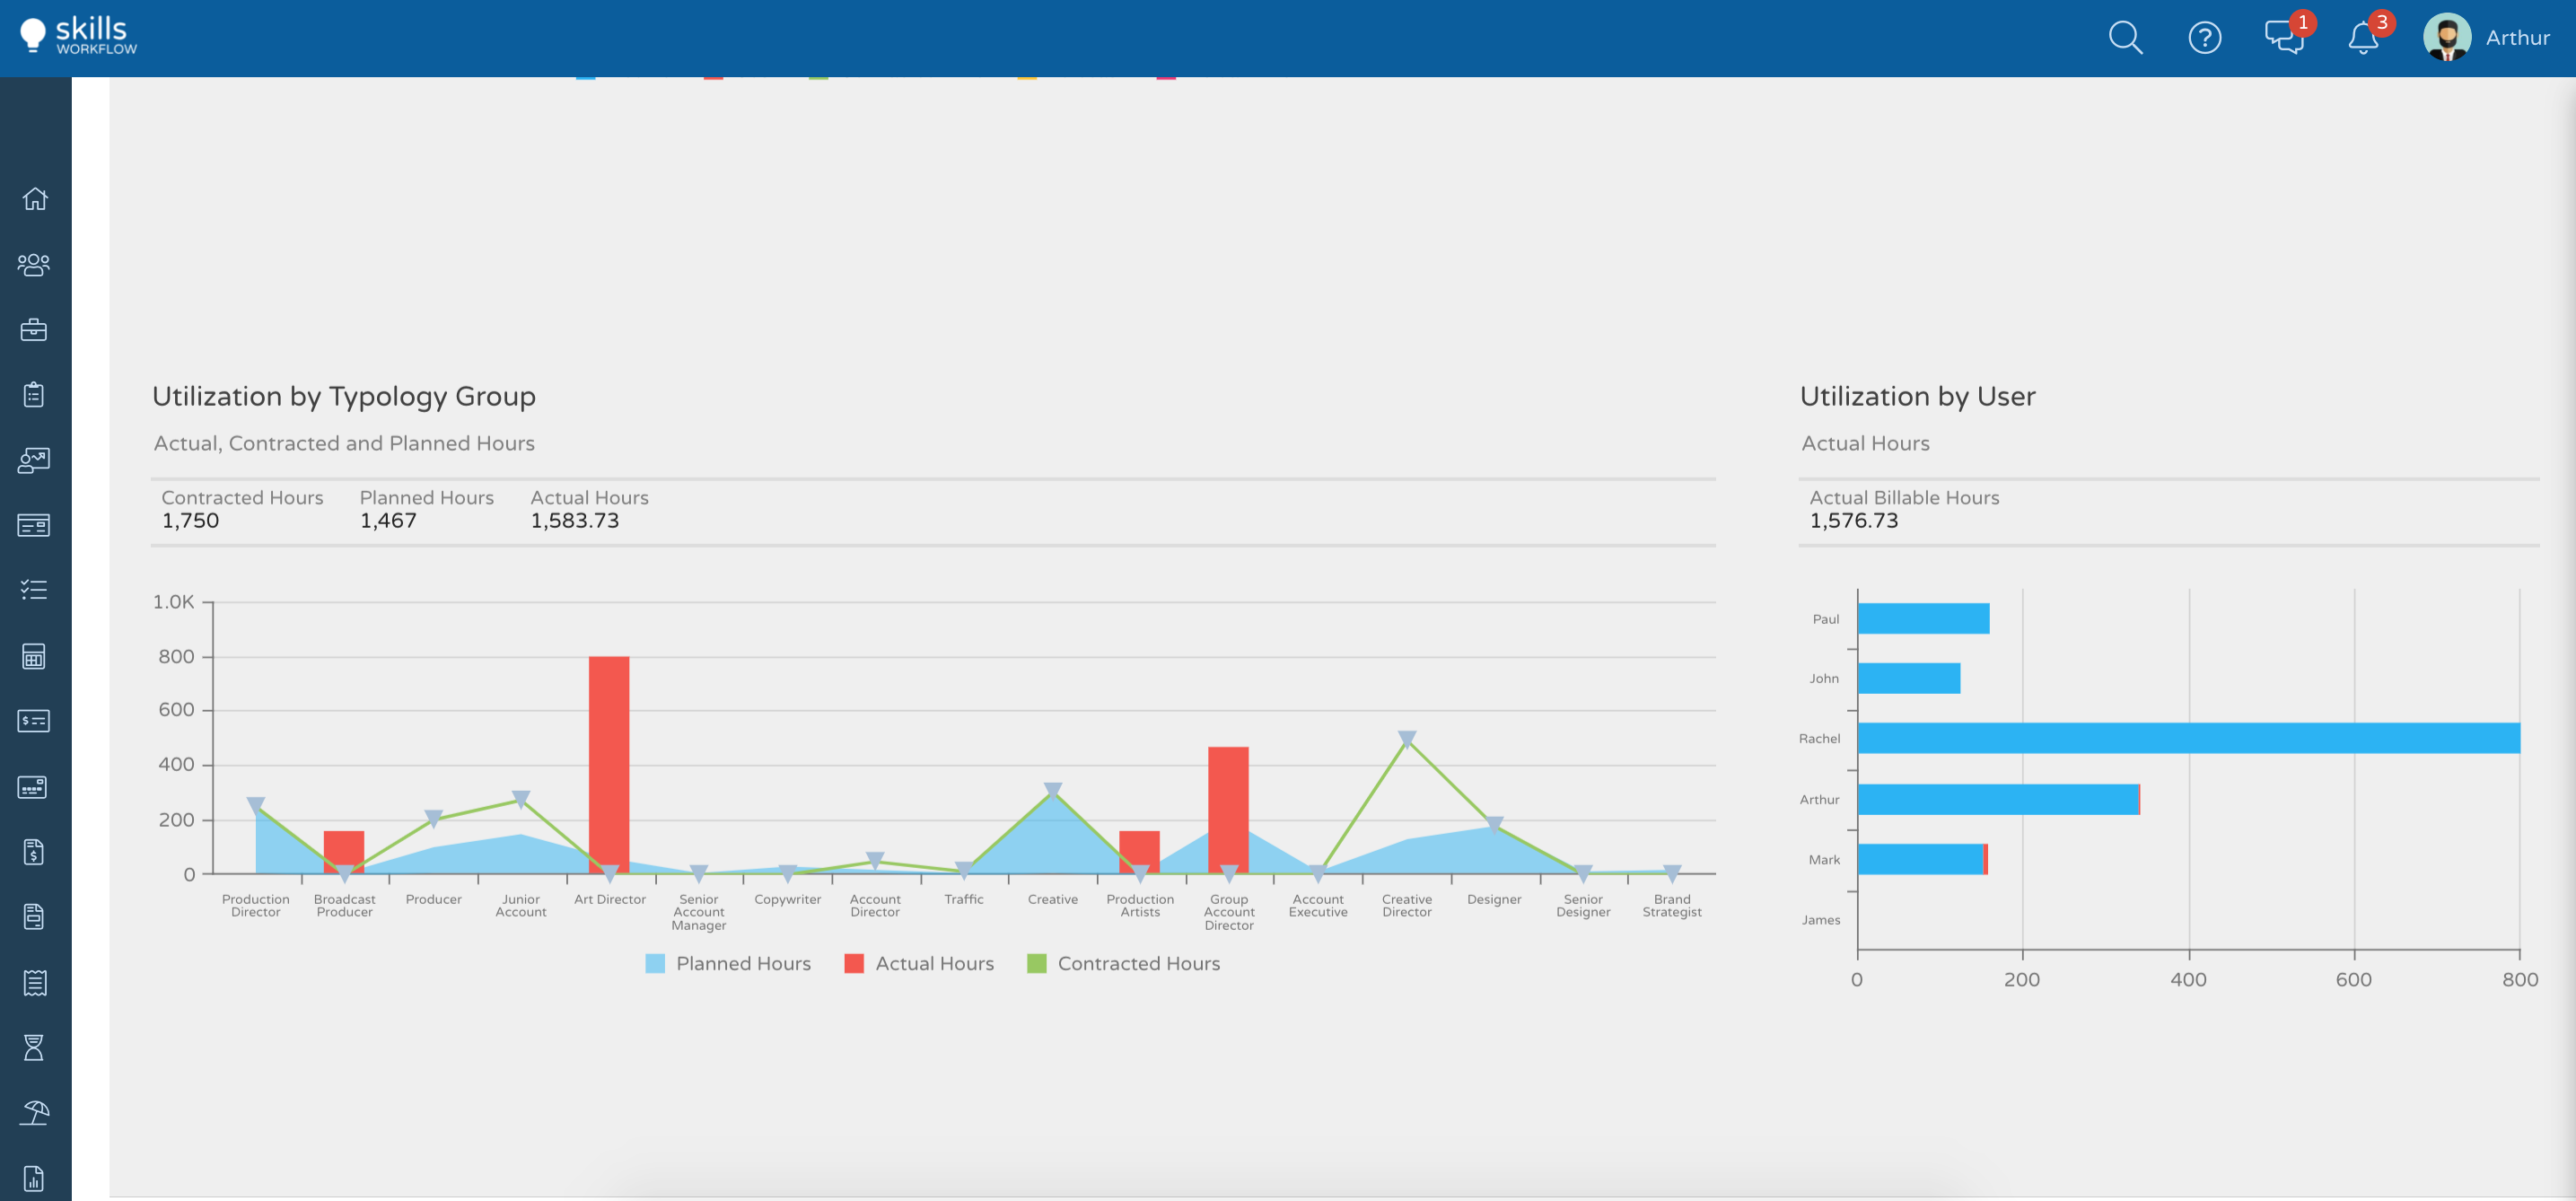
Utilization by Typology Group
This representation will allow you to check if the planned hours or actual hours are burning the contracted hours you have previously sold to your client.
Utilization by User
Also, you will be able to check which user is filling in more hours under your contract.